由于工作需要,接触了JFreeChart,但是JFreeChart默认的样式太不美观,而我对样式又不太感冒,所以比较头疼。
这里说一下我的观点:根据MVC的设计思想,数据应该与展现分开。也就是说,对于不同的报表,我们关心的只是数据的不同:有什么样的数据,展现什么样的报表,而样式,可以是统一的。
后来在网上找到一篇非常不错的文章,原文地址:。
我修改了一下代码,做成一个工厂类,更符合我们的需要。
工厂类——ChartFactory.java:
package cn.lym.jfreechart;import java.awt.Color;import java.util.Vector;import org.jfree.chart.JFreeChart;import org.jfree.chart.block.BlockBorder;import org.jfree.data.category.DefaultCategoryDataset;import org.jfree.data.general.DefaultPieDataset;import org.jfree.ui.RectangleEdge;/** * 生成JFreeChart图表的工厂类 * 目的:根据MVC的设计思想,数据与展现分离。调用者只需传入数据,即可生成图表。 * * @author liuyimin * */public class ChartFactory { /** * 生成柱状图 * * @param title * 柱状图的标题 * @param categoryAxisLabel * x轴标题 * @param valueAxisLabel * y轴标题 * @param series * 数据 * @param categories * 类别 * @return */ public static JFreeChart createBarChart(String title, String categoryAxisLabel, String valueAxisLabel, Vector series, String[] categories) { // 1:创建数据集合 DefaultCategoryDataset dataset = ChartUtils .createDefaultCategoryDataset(series, categories); JFreeChart chart = org.jfree.chart.ChartFactory.createBarChart(title, categoryAxisLabel, valueAxisLabel, dataset); // 3:设置抗锯齿,防止字体显示不清楚 ChartUtils.setAntiAlias(chart);// 抗锯齿 // 4:对柱子进行渲染 ChartUtils.setBarRenderer(chart.getCategoryPlot(), false);// // 5:对其他部分进行渲染 ChartUtils.setXAixs(chart.getCategoryPlot());// X坐标轴渲染 ChartUtils.setYAixs(chart.getCategoryPlot());// Y坐标轴渲染 // 设置标注无边框 chart.getLegend().setFrame(new BlockBorder(Color.WHITE)); return chart; } /** * 生成饼图 * * @param title * 饼图的标题 * @param categories * 类别 * @param datas * 数据 * @return */ public static JFreeChart createPieChart(String title, String[] categories, Object[] datas) { // 1:创建数据集合 DefaultPieDataset dataset = ChartUtils.createDefaultPieDataset( categories, datas); JFreeChart chart = org.jfree.chart.ChartFactory.createPieChart(title, dataset); // 3:设置抗锯齿,防止字体显示不清楚 ChartUtils.setAntiAlias(chart);// 抗锯齿 // 4:对柱子进行渲染[创建不同图形] ChartUtils.setPieRender(chart.getPlot()); /** * 可以注释测试 */ // plot.setSimpleLabels(true);//简单标签,不绘制线条 // plot.setLabelGenerator(null);//不显示数字 // 设置标注无边框 chart.getLegend().setFrame(new BlockBorder(Color.WHITE)); // 标注位于右侧 chart.getLegend().setPosition(RectangleEdge.RIGHT); return chart; } /** * 生成折线图 * * @param title * 折线图的标题 * @param categoryAxisLabel * x轴标题 * @param valueAxisLabel * y轴标题 * @param series * 数据 * @param categories * 类别 * @return */ public static JFreeChart createLineChart(String title, String categoryAxisLabel, String valueAxisLabel, Vector series, String[] categories) { // 1:创建数据集合 DefaultCategoryDataset dataset = ChartUtils .createDefaultCategoryDataset(series, categories); JFreeChart chart = org.jfree.chart.ChartFactory.createLineChart(title, categoryAxisLabel, valueAxisLabel, dataset); // 3:设置抗锯齿,防止字体显示不清楚 ChartUtils.setAntiAlias(chart);// 抗锯齿 // 4:对柱子进行渲染[[采用不同渲染]] ChartUtils.setLineRender(chart.getCategoryPlot(), false, true);// // 5:对其他部分进行渲染 ChartUtils.setXAixs(chart.getCategoryPlot());// X坐标轴渲染 ChartUtils.setYAixs(chart.getCategoryPlot());// Y坐标轴渲染 // 设置标注无边框 chart.getLegend().setFrame(new BlockBorder(Color.WHITE)); return chart; } /** * 生成StackedBarChart * * @param title * StackedBarChart的标题 * @param domainAxisLabel * @param rangeAxisLabel * @param series * 数据 * @param categories * 类别 * @return */ public static JFreeChart createStackedBarChart(String title, String domainAxisLabel, String rangeAxisLabel, Vector series, String[] categories) { // 1:创建数据集合 DefaultCategoryDataset dataset = ChartUtils .createDefaultCategoryDataset(series, categories); JFreeChart chart = org.jfree.chart.ChartFactory.createStackedBarChart( title, domainAxisLabel, rangeAxisLabel, dataset); // 3:设置抗锯齿,防止字体显示不清楚 ChartUtils.setAntiAlias(chart);// 抗锯齿 // 4:对柱子进行渲染[创建不同图形] ChartUtils.setStackBarRender(chart.getCategoryPlot()); // 5:对其他部分进行渲染 ChartUtils.setXAixs(chart.getCategoryPlot());// X坐标轴渲染 ChartUtils.setYAixs(chart.getCategoryPlot());// Y坐标轴渲染 // 设置标注无边框 chart.getLegend().setFrame(new BlockBorder(Color.WHITE)); return chart; }}
用到的工具类:ChartUtils.java
package cn.lym.jfreechart;import java.awt.BasicStroke;import java.awt.Color;import java.awt.Font;import java.awt.Paint;import java.awt.Rectangle;import java.text.DecimalFormat;import java.text.NumberFormat;import java.text.ParseException;import java.text.SimpleDateFormat;import java.util.Date;import java.util.Vector;import org.jfree.chart.ChartFactory;import org.jfree.chart.JFreeChart;import org.jfree.chart.StandardChartTheme;import org.jfree.chart.axis.DateAxis;import org.jfree.chart.axis.DateTickUnit;import org.jfree.chart.axis.DateTickUnitType;import org.jfree.chart.axis.ValueAxis;import org.jfree.chart.block.BlockBorder;import org.jfree.chart.labels.ItemLabelAnchor;import org.jfree.chart.labels.ItemLabelPosition;import org.jfree.chart.labels.StandardCategoryItemLabelGenerator;import org.jfree.chart.labels.StandardPieSectionLabelGenerator;import org.jfree.chart.labels.StandardXYItemLabelGenerator;import org.jfree.chart.labels.StandardXYToolTipGenerator;import org.jfree.chart.plot.CategoryPlot;import org.jfree.chart.plot.DefaultDrawingSupplier;import org.jfree.chart.plot.PieLabelLinkStyle;import org.jfree.chart.plot.PiePlot;import org.jfree.chart.plot.Plot;import org.jfree.chart.plot.XYPlot;import org.jfree.chart.renderer.category.BarRenderer;import org.jfree.chart.renderer.category.LineAndShapeRenderer;import org.jfree.chart.renderer.category.StackedBarRenderer;import org.jfree.chart.renderer.category.StandardBarPainter;import org.jfree.chart.renderer.xy.StandardXYBarPainter;import org.jfree.chart.renderer.xy.XYBarRenderer;import org.jfree.chart.renderer.xy.XYLineAndShapeRenderer;import org.jfree.data.category.DefaultCategoryDataset;import org.jfree.data.general.DefaultPieDataset;import org.jfree.data.time.Day;import org.jfree.data.time.TimeSeries;import org.jfree.ui.RectangleInsets;import org.jfree.ui.TextAnchor;/** * Jfreechart工具类 ** 解决中文乱码问题
* 用来创建类别图表数据集、创建饼图数据集、时间序列图数据集 * 用来对柱状图、折线图、饼图、堆积柱状图、时间序列图的样式进行渲染 * 设置X-Y坐标轴样式 ** * * @author chenchangwen * @since:2014-2-18 * */public class ChartUtils { private static String NO_DATA_MSG = "数据加载失败"; private static Font FONT = new Font("宋体", Font.PLAIN, 12); public static Color[] CHART_COLORS = { new Color(31, 129, 188), new Color(92, 92, 97), new Color(144, 237, 125), new Color(255, 188, 117), new Color(153, 158, 255), new Color(255, 117, 153), new Color(253, 236, 109), new Color(128, 133, 232), new Color(158, 90, 102), new Color(255, 204, 102) };// 颜色 static { setChartTheme(); } public ChartUtils() { } /** * 中文主题样式 解决乱码 */ public static void setChartTheme() { // 设置中文主题样式 解决乱码 StandardChartTheme chartTheme = new StandardChartTheme("CN"); // 设置标题字体 chartTheme.setExtraLargeFont(FONT); // 设置图例的字体 chartTheme.setRegularFont(FONT); // 设置轴向的字体 chartTheme.setLargeFont(FONT); chartTheme.setSmallFont(FONT); chartTheme.setTitlePaint(new Color(51, 51, 51)); chartTheme.setSubtitlePaint(new Color(85, 85, 85)); chartTheme.setLegendBackgroundPaint(Color.WHITE);// 设置标注 chartTheme.setLegendItemPaint(Color.BLACK);// chartTheme.setChartBackgroundPaint(Color.WHITE); // 绘制颜色绘制颜色.轮廓供应商 // paintSequence,outlinePaintSequence,strokeSequence,outlineStrokeSequence,shapeSequence Paint[] OUTLINE_PAINT_SEQUENCE = new Paint[] { Color.WHITE }; // 绘制器颜色源 DefaultDrawingSupplier drawingSupplier = new DefaultDrawingSupplier( CHART_COLORS, CHART_COLORS, OUTLINE_PAINT_SEQUENCE, DefaultDrawingSupplier.DEFAULT_STROKE_SEQUENCE, DefaultDrawingSupplier.DEFAULT_OUTLINE_STROKE_SEQUENCE, DefaultDrawingSupplier.DEFAULT_SHAPE_SEQUENCE); chartTheme.setDrawingSupplier(drawingSupplier); chartTheme.setPlotBackgroundPaint(Color.WHITE);// 绘制区域 chartTheme.setPlotOutlinePaint(Color.WHITE);// 绘制区域外边框 chartTheme.setLabelLinkPaint(new Color(8, 55, 114));// 链接标签颜色 chartTheme.setLabelLinkStyle(PieLabelLinkStyle.CUBIC_CURVE); chartTheme.setAxisOffset(new RectangleInsets(5, 12, 5, 12)); chartTheme.setDomainGridlinePaint(new Color(192, 208, 224));// X坐标轴垂直网格颜色 chartTheme.setRangeGridlinePaint(new Color(192, 192, 192));// Y坐标轴水平网格颜色 chartTheme.setBaselinePaint(Color.WHITE); chartTheme.setCrosshairPaint(Color.BLUE);// 不确定含义 chartTheme.setAxisLabelPaint(new Color(51, 51, 51));// 坐标轴标题文字颜色 chartTheme.setTickLabelPaint(new Color(67, 67, 72));// 刻度数字 chartTheme.setBarPainter(new StandardBarPainter());// 设置柱状图渲染 chartTheme.setXYBarPainter(new StandardXYBarPainter());// XYBar 渲染 chartTheme.setItemLabelPaint(Color.black); chartTheme.setThermometerPaint(Color.white);// 温度计 ChartFactory.setChartTheme(chartTheme); } /** * 必须设置文本抗锯齿 */ public static void setAntiAlias(JFreeChart chart) { chart.setTextAntiAlias(false); } /** * 设置图例无边框,默认黑色边框 */ public static void setLegendEmptyBorder(JFreeChart chart) { chart.getLegend().setFrame(new BlockBorder(Color.WHITE)); } /** * 创建类别数据集合 */ public static DefaultCategoryDataset createDefaultCategoryDataset( Vector
series, String[] categories) { DefaultCategoryDataset dataset = new DefaultCategoryDataset(); for (Serie serie : series) { String name = serie.getName(); Vector
POJO类:Serie.java
package cn.lym.jfreechart;import java.io.Serializable;import java.util.Vector;/** * 系列:名字和数据集合 构成一条曲线 可以将serie看作一根线或者一根柱子: * ** 参照JS图表来描述数据:
series: [{ name: 'Tokyo', data: [7.0, 6.9, 9.5, 14.5] * }, { name: 'New York', data: [-0.2, 0.8, 5.7, 11.3} ] * * * @author ccw * @date 2014-6-4 */public class Serie implements Serializable { private static final long serialVersionUID = 1L; private String name;// 名字 private Vector
测试类:ChartFactoryTest.java
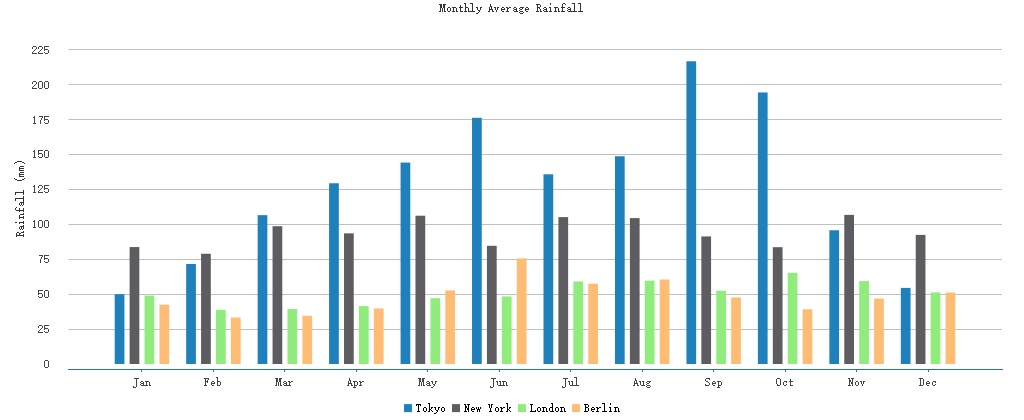
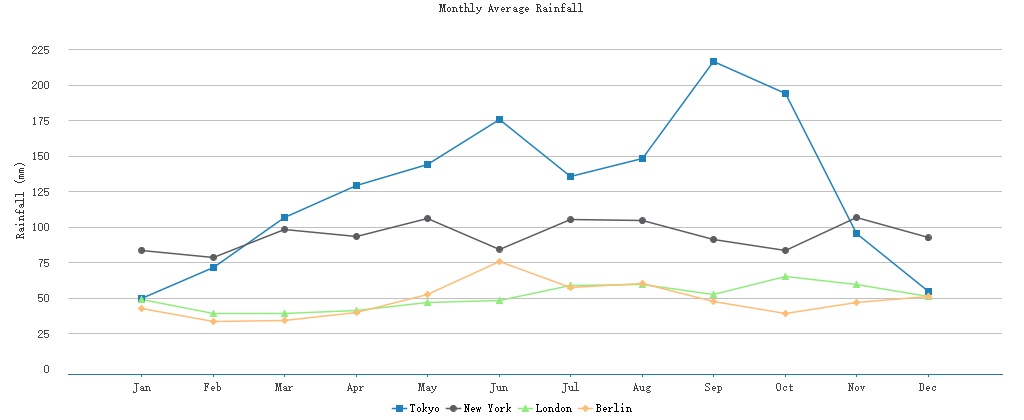
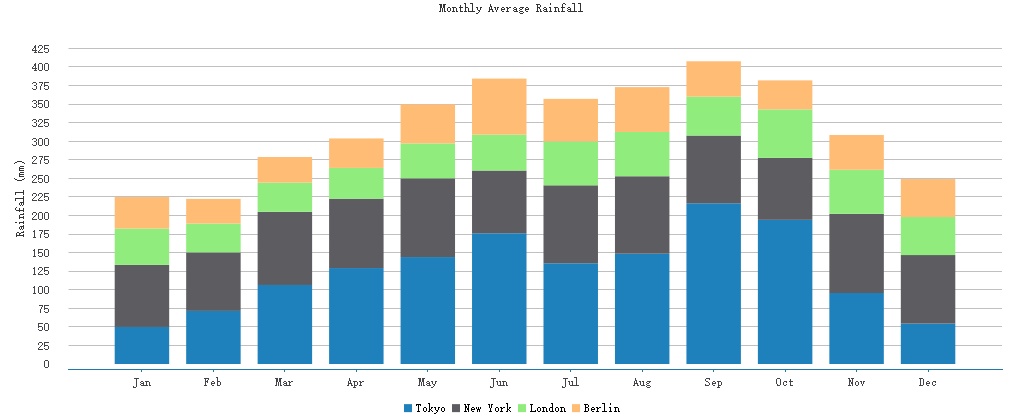
package cn.lym.jfreechart;import java.io.File;import java.util.Vector;import org.jfree.chart.ChartUtilities;import org.jfree.chart.JFreeChart;import org.junit.Test;public class ChartFactoryTest { /** * 测试柱状图 * * @throws Exception */ @Test public void testCreateBarChart() throws Exception { // 标注类别 String[] categories = { "Jan", "Feb", "Mar", "Apr", "May", "Jun", "Jul", "Aug", "Sep", "Oct", "Nov", "Dec" }; Vector series = new Vector (); // 柱子名称:柱子所有的值集合 series.add(new Serie("Tokyo", new Double[] { 49.9, 71.5, 106.4, 129.2, 144.0, 176.0, 135.6, 148.5, 216.4, 194.1, 95.6, 54.4 })); series.add(new Serie("New York", new Double[] { 83.6, 78.8, 98.5, 93.4, 106.0, 84.5, 105.0, 104.3, 91.2, 83.5, 106.6, 92.3 })); series.add(new Serie("London", new Double[] { 48.9, 38.8, 39.3, 41.4, 47.0, 48.3, 59.0, 59.6, 52.4, 65.2, 59.3, 51.2 })); series.add(new Serie("Berlin", new Double[] { 42.4, 33.2, 34.5, 39.7, 52.6, 75.5, 57.4, 60.4, 47.6, 39.1, 46.8, 51.1 })); String title = "Monthly Average Rainfall"; String categoryAxisLabel = ""; String valueAxisLabel = "Rainfall (mm)"; JFreeChart chart = ChartFactory.createBarChart(title, categoryAxisLabel, valueAxisLabel, series, categories); File file = new File("D:\\jfreechart\\barChart.jpeg"); int width = 1024; int height = 420; ChartUtilities.saveChartAsJPEG(file, chart, width, height); } /** * 测试饼图 * * @throws Exception */ @Test public void testCreatePieChart() throws Exception { String[] categories = { "Bananas", "Kiwi", "Mixed nuts", "Oranges", "Apples", "Pears", "Clementines", "Reddish (bag)", "Grapes (bunch)", }; Object[] datas = { 8, 3, 1, 6, 8, 4, 4, 1, 1 }; String title = "Contents of Highsoft's weekly fruit delivery"; JFreeChart chart = ChartFactory .createPieChart(title, categories, datas); File file = new File("D:\\jfreechart\\pieChart.jpeg"); int width = 1024; int height = 420; ChartUtilities.saveChartAsJPEG(file, chart, width, height); } /** * 测试折线图 * * @throws Exception */ @Test public void testCreateLineChart() throws Exception { // 标注类别 String[] categories = { "Jan", "Feb", "Mar", "Apr", "May", "Jun", "Jul", "Aug", "Sep", "Oct", "Nov", "Dec" }; Vector series = new Vector (); // 柱子名称:柱子所有的值集合 series.add(new Serie("Tokyo", new Double[] { 49.9, 71.5, 106.4, 129.2, 144.0, 176.0, 135.6, 148.5, 216.4, 194.1, 95.6, 54.4 })); series.add(new Serie("New York", new Double[] { 83.6, 78.8, 98.5, 93.4, 106.0, 84.5, 105.0, 104.3, 91.2, 83.5, 106.6, 92.3 })); series.add(new Serie("London", new Double[] { 48.9, 38.8, 39.3, 41.4, 47.0, 48.3, 59.0, 59.6, 52.4, 65.2, 59.3, 51.2 })); series.add(new Serie("Berlin", new Double[] { 42.4, 33.2, 34.5, 39.7, 52.6, 75.5, 57.4, 60.4, 47.6, 39.1, 46.8, 51.1 })); String title = "Monthly Average Rainfall"; String categoryAxisLabel = ""; String valueAxisLabel = "Rainfall (mm)"; JFreeChart chart = ChartFactory.createLineChart(title, categoryAxisLabel, valueAxisLabel, series, categories); File file = new File("D:\\jfreechart\\lineChart.jpeg"); int width = 1024; int height = 420; ChartUtilities.saveChartAsJPEG(file, chart, width, height); } /** * 测试StackedBarChart * * @throws Exception */ @Test public void testCreateStackedBarChart() throws Exception { // 标注类别 String[] categories = { "Jan", "Feb", "Mar", "Apr", "May", "Jun", "Jul", "Aug", "Sep", "Oct", "Nov", "Dec" }; Vector series = new Vector (); // 柱子名称:柱子所有的值集合 series.add(new Serie("Tokyo", new Double[] { 49.9, 71.5, 106.4, 129.2, 144.0, 176.0, 135.6, 148.5, 216.4, 194.1, 95.6, 54.4 })); series.add(new Serie("New York", new Double[] { 83.6, 78.8, 98.5, 93.4, 106.0, 84.5, 105.0, 104.3, 91.2, 83.5, 106.6, 92.3 })); series.add(new Serie("London", new Double[] { 48.9, 38.8, 39.3, 41.4, 47.0, 48.3, 59.0, 59.6, 52.4, 65.2, 59.3, 51.2 })); series.add(new Serie("Berlin", new Double[] { 42.4, 33.2, 34.5, 39.7, 52.6, 75.5, 57.4, 60.4, 47.6, 39.1, 46.8, 51.1 })); String title = "Monthly Average Rainfall"; String domainAxisLabel = ""; String rangeAxisLabel = "Rainfall (mm)"; JFreeChart chart = ChartFactory.createStackedBarChart(title, domainAxisLabel, rangeAxisLabel, series, categories); File file = new File("D:\\jfreechart\\stackedBarChart.jpeg"); int width = 1024; int height = 420; ChartUtilities.saveChartAsJPEG(file, chart, width, height); }}
生成的图表:
1. 柱状图

2. 饼图

3. 折线图

4. StackedBarChart

项目地址: